|
An Online User
Interface for Tracking Stock Portfolios
|
|
|
ABSTRACT >>
Currently, an abundance of websites offer online services to track the
performance of stock portfolios. However, the most comprehensive options may
require a fee and usually do not provide advice tailored to the investor. An
online user interface offers wide-ranging analysis of stock performance and
counsel on managing the portfolio based on a concurrent study in technical
analysis and other strategies used to predict stock movements. This project
combines the convenience of other online interfaces with the personalized
guidance typically reserved for paper in order to create a single destination
for viewing past performance, current conditions, and future possibilities.
|
|
|
INTRODUCTION >>
An online database is used to track stock movements and related data. A variety
of charts are available to the user, who is able to select scales, timeframes,
and other variables. The presentation of investor-specific advice and analysis
is based on the results of the simultaneous project regarding the performance of
various strategies in predicting stock movements. As more patterns emerge from
this project, the level of advice is elevated to include the newest conclusions
on managing a portfolio. While the program incorporates a view to large profits
in the short term and "hot" stocks, the focus is based on a long period of
investment and solid, reliable performers.
|
|
|
METHODOLOGY >>
This project, which primarily
uses PHP and MySQL, consists of four main phases. The first major step is
extensive research of online user interfaces, database organization, and data
retrieval. Following this preparatory period, the interface is created with a
basic level of functionality. Next, advice and analysis are combined with a
refined interface that is marked by thoroughness and ease of use. Finally, all
features are further enhanced to incorporate additional conclusions of the
related project in a final testing of sample portfolios.
|
|
|
RESULT >>
The final result is an online
financial manager that provides detailed analysis of stock movements and
personalized advice, presented according to the aesthetic preferences of the
user. Thorough research in the technical and financial aspects of the project
allow the combination of the online user interface and the analytical program to
give users reliable suggestions in the uncertain world of portfolio
management.
|
|
Joseph Hess
Computer Systems
2002–2003 |
|
|
|
|
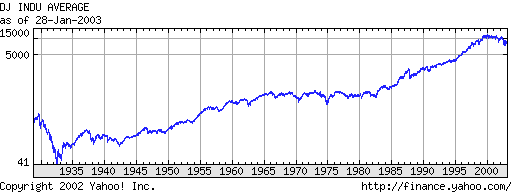
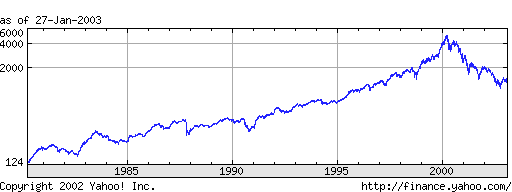
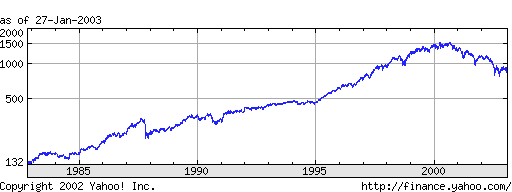
This sample portfolio includes the performace of the major American
indices and pricing, identifying, and technical data for AT&T Corporation
and the Coca-Cola Company. |
|
SOME FACTS ON INVESTING FROM SALOMON SMITH
BARNEY >>
In 1998, a $100 investment made in 1925 was worth
approximately:
—$551,600 if invested in small-company
stocks.
—$235,100 if invested in large-company
stocks.
—$4,400 is invested in long-term
government bonds.
—$1,500 if invested in treasury
bills.
—$900 if the money kept pace with
inflation.
If one invested in the Standard & Poor's 500 from 1926 through 1992, the
likelihood of achieving a positive return (with dividends reinvested) was:
—50% if invested for one day.
—69% if invested for one year.
—89% if invested for five years.
—97% if invested for 10 years.
—100% if invested for 15 years.
For the investment period of mid-1982 to mid-1987 (1,276 trading days),
the annualized return for the Standard & Poor's 500 was 26.30%. The
University of Michigan determined that missing the top:
—10 gain days reduced the return by 30.4%, to 18.33%.
—20 gain days reduced the return by 50.2%, to 13.15%.
—30 gain days reduced the return by 67.7%, to 8.56%.
—40 gain days reduced the return by 83.7%, to 4.38%.
|
|

Dow Jones Industrial

NASDAQ Composite

Standard & Poor's 500
|
|
The corresponding program will analyze historical trends in the American
markets to provide personalized advice to users.
|
|
|