Supercomputer Applications
Generating a Surface
Three Dimensional Surfaces
Three dimensional surfaces can be useful for studying complex data sets.
Histograms are helpful for looking at data with just one
variable, lines or curves plotted in a coordinate plane are useful
for comparing data sets with two independent variables. When data sets
contain three variables, curves in three-space or sometimes surfaces
can be used to compare the inter-relation of the three components.
When plotting the surface illustrated below, the "x" and "z" values of
the region were treated as a grid of points, and then the
height, or the "y" component, was calculated. This shows how
the "y" component changes with respect to both "x" and "z". A similar
surface parallel to the "x-y" plane could be used to study how "z" depends
upon the other variables.
In many scientific experiments, there are often four or variables involved
in relationships, but it is difficult for those of us live in 3D to visualize
something in 4-Dimensions. However,
we can combine the 3-dimensional surface with color to represent
that fourth component, thus giving us a way to visualize a four dimensional
data set.
A Program to Create a Colored 3-D Surface
|
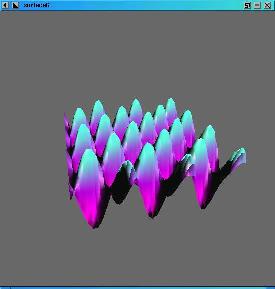
This program generates 3-D surface and includes the use
of lighting effects.
In order to draw the surface the region is cut into a number of triangle
strips that go from one side to the other. The height of the surface is
calculated by finding the product of two sine waves, thus giging the
undulating quality. For each triangle, the three vertex points are sent
to a special routine that calculates the normal vector,
a directional value that is perpendicular to the triangle surface.
From this information and the color of the surface at that point,
the OpenGL lighting commands determine how much light will strike the surface
and what color the triangel will be. Look closely at the computer code that
calculates the normals as well as the description in your text to learn
more about normal vectors and lighting as well as the following page on
Normal Vectors and other 3-D Graphics Details.
It is important to note that the normals must be
calculated in the proper sequence because they are directional. Ones that
point in the direction of the light source will receive light whereas
those that point away will be in shadow. If all of the vectors of a
surface are not calculated in the same way, some triangles will be colored
yet others will be appear dark because they are in the shade. This
can cause strangely colored surfaces!
Source Code: surface.c
|
Combining Graphics Images with a Surface
It is often helpful to overlay an image in 3-D with a graphic that
represents the coloring. If you are need help on understanding
how to work with graphic images, check out the following page:
-
Graphics File Formats
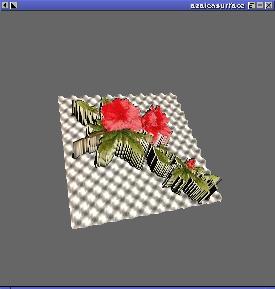
Using the basic format of the surface program above, the following
example replaces two routines in order to generate a more interesting
surface. It essentially tries to overlay the graphic of the azalea
image on top of an embossed or raised surface that also relates to
the same picture. Look at how the two algorithms are used to create
an interesting effect:
Determing the Altitude
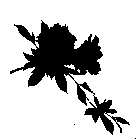
To generate the altitude, I used a combination of the
black and white silhouette algorithm used preveiosly
along with the sine wave function described in the surface program
given on this page. Essentially, wherever the picture was white, a wavy
surface ranging from -2 to + 2 was used. Where the picture
was colored in the region of the azalea plant and flower, the altitude
was set at a uniform 20 units high.
|
Black and White
|
Determining the Color
To determine the color of the surface, the RGB values in the original picture
were used. One thing to note is that the pixel values in a
PPM image are given in RGB format as integers
whereas the OpenGL command expects color values to be expressed as
floats. Good programmers should be able to make the
conversion easily.
|
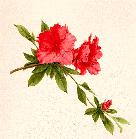
Original Picture
|
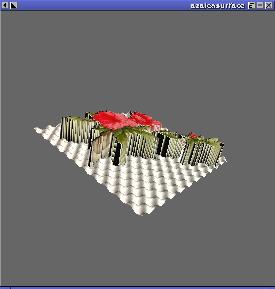
The Combined Image
Notice how the combined image has a height elevation relating to the
silhouette, yet the same essential color of the original graphic.
The surface can be manipulated in 3-D using various keyboard routines.


